
The biggest mystery of ultraluminous X- ray sources (ULXs) is the mass of the central compact object. Due to their high X-ray luminosity LX > 1039 erg.s-1, ULXs have been suggested as a prime candidates to host intermediate- mass black hole ~ 102 – 104 Mʘ.
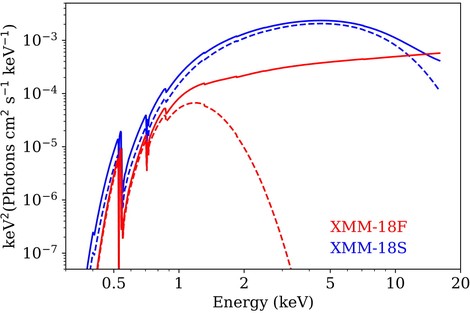
However, the notion of every ULX harboring an IMBH conflicts with population studies, since it would imply too high an IMBH formation rate in star-forming galaxies. Therefore, any similarity of ULXs to accreting X-ray binaries may suggest stellar mass black hole with super-Eddington accretion. Recently, scientists from CAMK PAN in Warsaw: Samaresh Mondal, Agata Różańska and Alex Markowitz in collaboration with Patrycja Bagińska and Barbara De Marco, by analyzing multi-epoch XMM-Newton, NuSTAR and Suzaku data have found at least three distinctive spectral states of Circinus ULX5 (left panel of the figure), in analogy to stat transitions in Galactic X-ray binaries. Disk-dominated spectra (right panel, blue line) are found in high flux states and the power-law (right panel, red line) dominated spectra are found in lower flux states. The source was also observed in an intermediate state, where the flux is low, but the spectrum is dominated by the disk component. Over eighteen years of collected data, ULX5 appeared two times in the high, three times in the low, and two times in the intermediate state. The fastest observed transition was 7 months.
Furthermore, in the high flux states, the inner disk radii are consistent with the innermost stable radius of a smaller mass compact object (<10 Mʘ). The inner disk temperature (T) and flux closely follows a relation Fdisk proportional to T2 , indicating accretion rate above the critical Eddington limit onto a stellar mass black hole. The research has been accepted for publication in Astronomy & Astrophysics.
For more details please check the original paper: "Spectral state transitions in Circinus ULX5 "
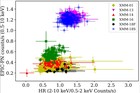
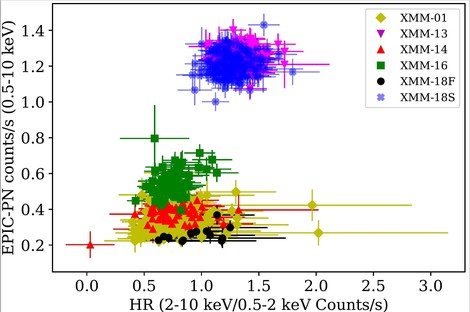
Figure: upper panel: The hardness ratio intensity diagram made from the XMM-Newton EPIC-pn light curves. All data sets are arranged in two islands. Lower panel: Unfolded models displaying two spectral states: power-law dominated observed in 2018 Feb. (red lines), and second disk dominated observed in 2018 Sept. (blue lines). Solid lines display total model, while dashed lines show the emission of disk component.
Text: Samaresh Mondal and Agata Różańska